📊 Gold (XAUUSD) Daily Timeframe Analysis – April 8 2026
🪙 Market Overview
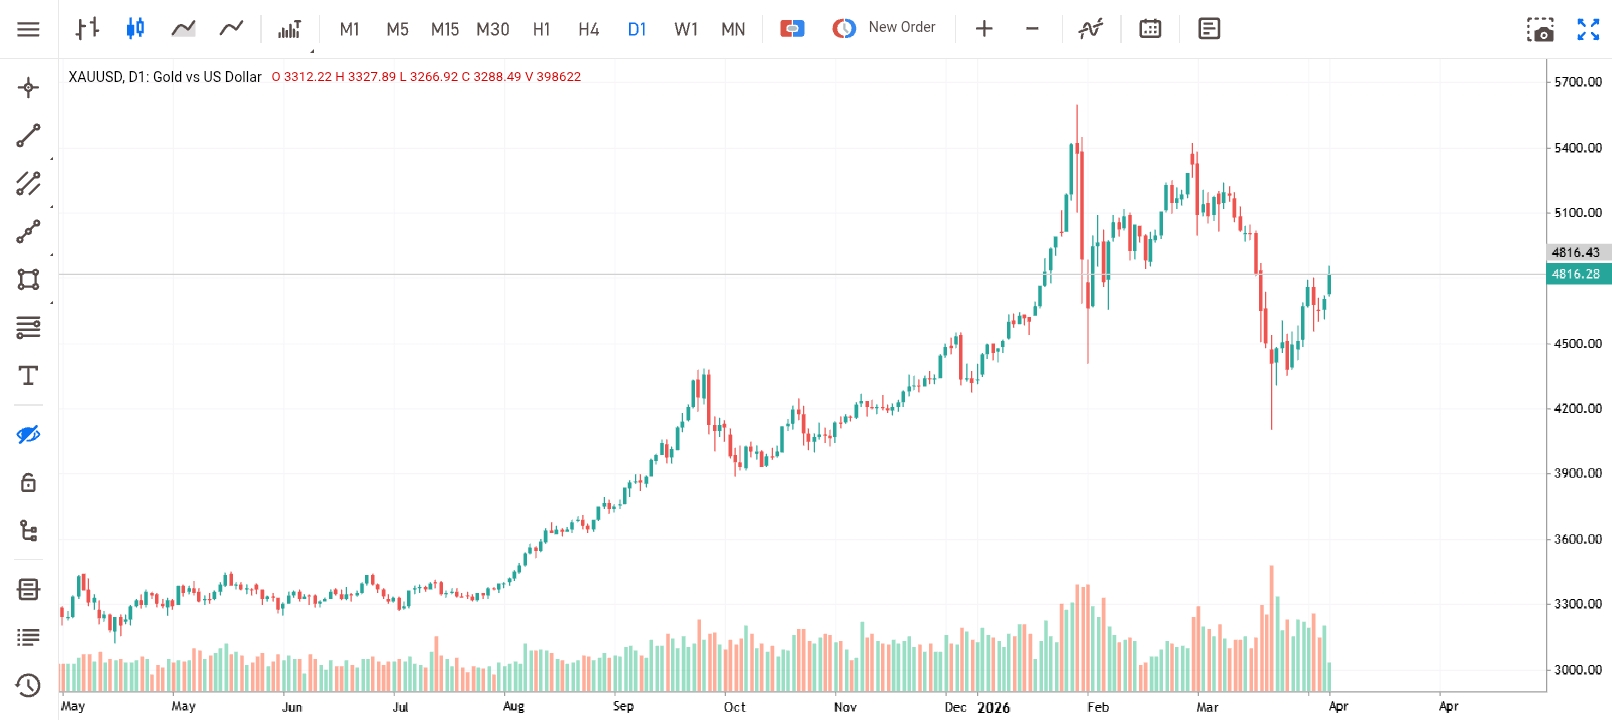
Looking at the daily (D1) timeframe, gold has been in a strong long-term uptrend, followed by a period of high volatility and correction.
Recently, price has started to recover after a sharp sell-off, now trading around the $4800 region.
📈 Key Price Action Insights
🔼 Previous Trend
- Strong bullish expansion from mid-2025 into early 2026
- Consistent higher highs and higher lows
- Momentum peaked with an explosive move above $5400
⚠️ Volatility & Reversal
Sudden sharp rejection from highs
Large bearish candles indicating:
- ❗ Profit-taking
- ❗ Institutional selling pressure
Price dropped aggressively toward the $4400 zone
🔄 Current Structure
Market is now:
- Forming a recovery bounce
- Printing higher lows (short-term)
- Approaching a key resistance around $4800–$4900
👉 This suggests a corrective phase inside a larger structure
🧠 Market Interpretation
The trend is no longer clean bullish
Current movement looks like:
- 🔁 Pullback within a broader range
- OR
- 🧱 Early stages of distribution
🎯 Key Levels to Watch
- 🔴 Resistance: $4800 – $5000
- 🟢 Support: $4400 – $4500
🔍 Trading Outlook
🔴 Bearish Scenario
Price rejects from $4800–$4900
Forms lower highs on lower timeframes
Moves back toward:
- $4600
- $4500
🟢 Bullish Scenario
- Strong break and hold above $5000
- Continuation toward previous highs
- Potential retest of $5200+
📌 Conclusion
Gold is currently transitioning from a strong bullish trend into a volatile consolidation phase. The next major move will likely depend on how price reacts at the $4800–$5000 resistance zone.
Patience is key—this is a higher timeframe decision area.
⚠️ Disclaimer
This analysis is for educational purposes only and not financial advice. Always manage your risk appropriately.