“Bitcoin at 70K: The Calm Before the Next Bull Run?”
Here is the English version of the BTC dip opportunity analysis based on your chart 👇
Market condition summary
From the chart:
Key data:
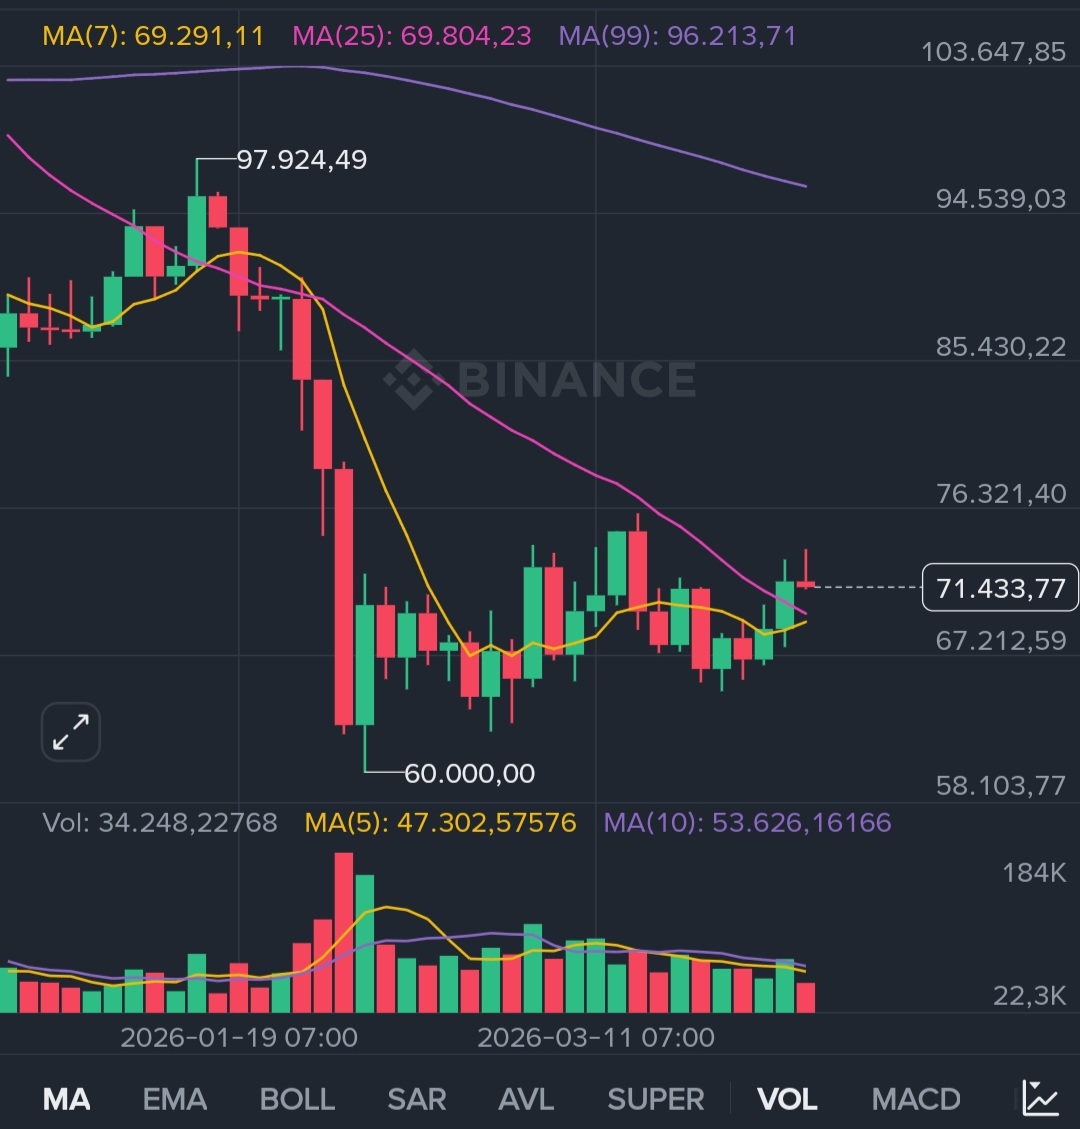
- Previous top: 97.9k
- Crash bottom: 60k
- Current price: around 71k
- MA(7) ≈ 69k
- MA(25) ≈ 69.8k
- MA(99) ≈ 96k (still far above price)
This tells us:
👉 BTC is in a recovery phase after a major crash.
1️⃣ Market has exited the panic-sell phase
Price structure shows 3 clear phases:
- Pump → 97k
- Sharp crash → 60k
- Sideways consolidation → 60k–72k (current)
This is important because:
- A big crash usually marks capitulation
- After capitulation → market enters accumulation
👉 Accumulation = the phase where smart money buys.
2️⃣ Early reversal signals are forming
Moving averages show:
- Price is now above MA7 & MA25
- MA7 is curving upward
- Candles are stabilizing sideways
This is a classic signal that:
The strong downtrend has stopped
The market is building a bottom
This phase often happens before a new bull run begins.
3️⃣ Risk vs Reward is very attractive now
Key zones from the chart:
Strong support:
- 60k = crash bottom
Major resistance:
- 96k = MA99 / previous ATH zone
If buying around 70k:
- Downside risk to 60k → -15%
- Upside to 96k → +35%
- If new ATH forms → +60–100% potential
👉 Small risk vs large reward = accumulation zone.
This is why large investors typically start buying here.
4️⃣ Selling pressure is weakening (Volume analysis)
Volume behavior:
- Huge volume during the crash (panic selling)
- Volume now decreasing and stabilizing
Meaning:
- Sellers are exhausted
- Selling pressure is fading
Typical next phase:
➡️ Slow climb → then strong breakout.
5️⃣ Market cycle position: Re-Accumulation phase
Typical BTC cycle:
| Phase | Status |
|---|---|
| Bull run | Completed |
| Crash | Completed |
| Accumulation | Happening now |
| New bull run | Not started yet |
👉 We are currently in the pre-bull-run phase.
This is the favorite phase for long-term investors.
Final conclusion
Based on the chart:
Buying opportunity looks strong because:
- Major crash already happened
- Price is stabilizing and slowly rising
- Risk is relatively small vs upside potential
- Market appears to be in accumulation phase
📌 This zone is ideal for:
- Dollar Cost Averaging (DCA)
- Medium to long-term holding