Caldo record in Europa, la mappa dell'ESA fa paura. / Record heat in Europe, ESA's map is scary. [ITA/ENG]
In queste ore, il nostro Continente si trova stretto nella morsa di una precocissima e violentissima ondata di calore che sta polverizzando i record storici di maggio di mezza Europa, facendo apparire la tarda primavera un lontano ricordo.
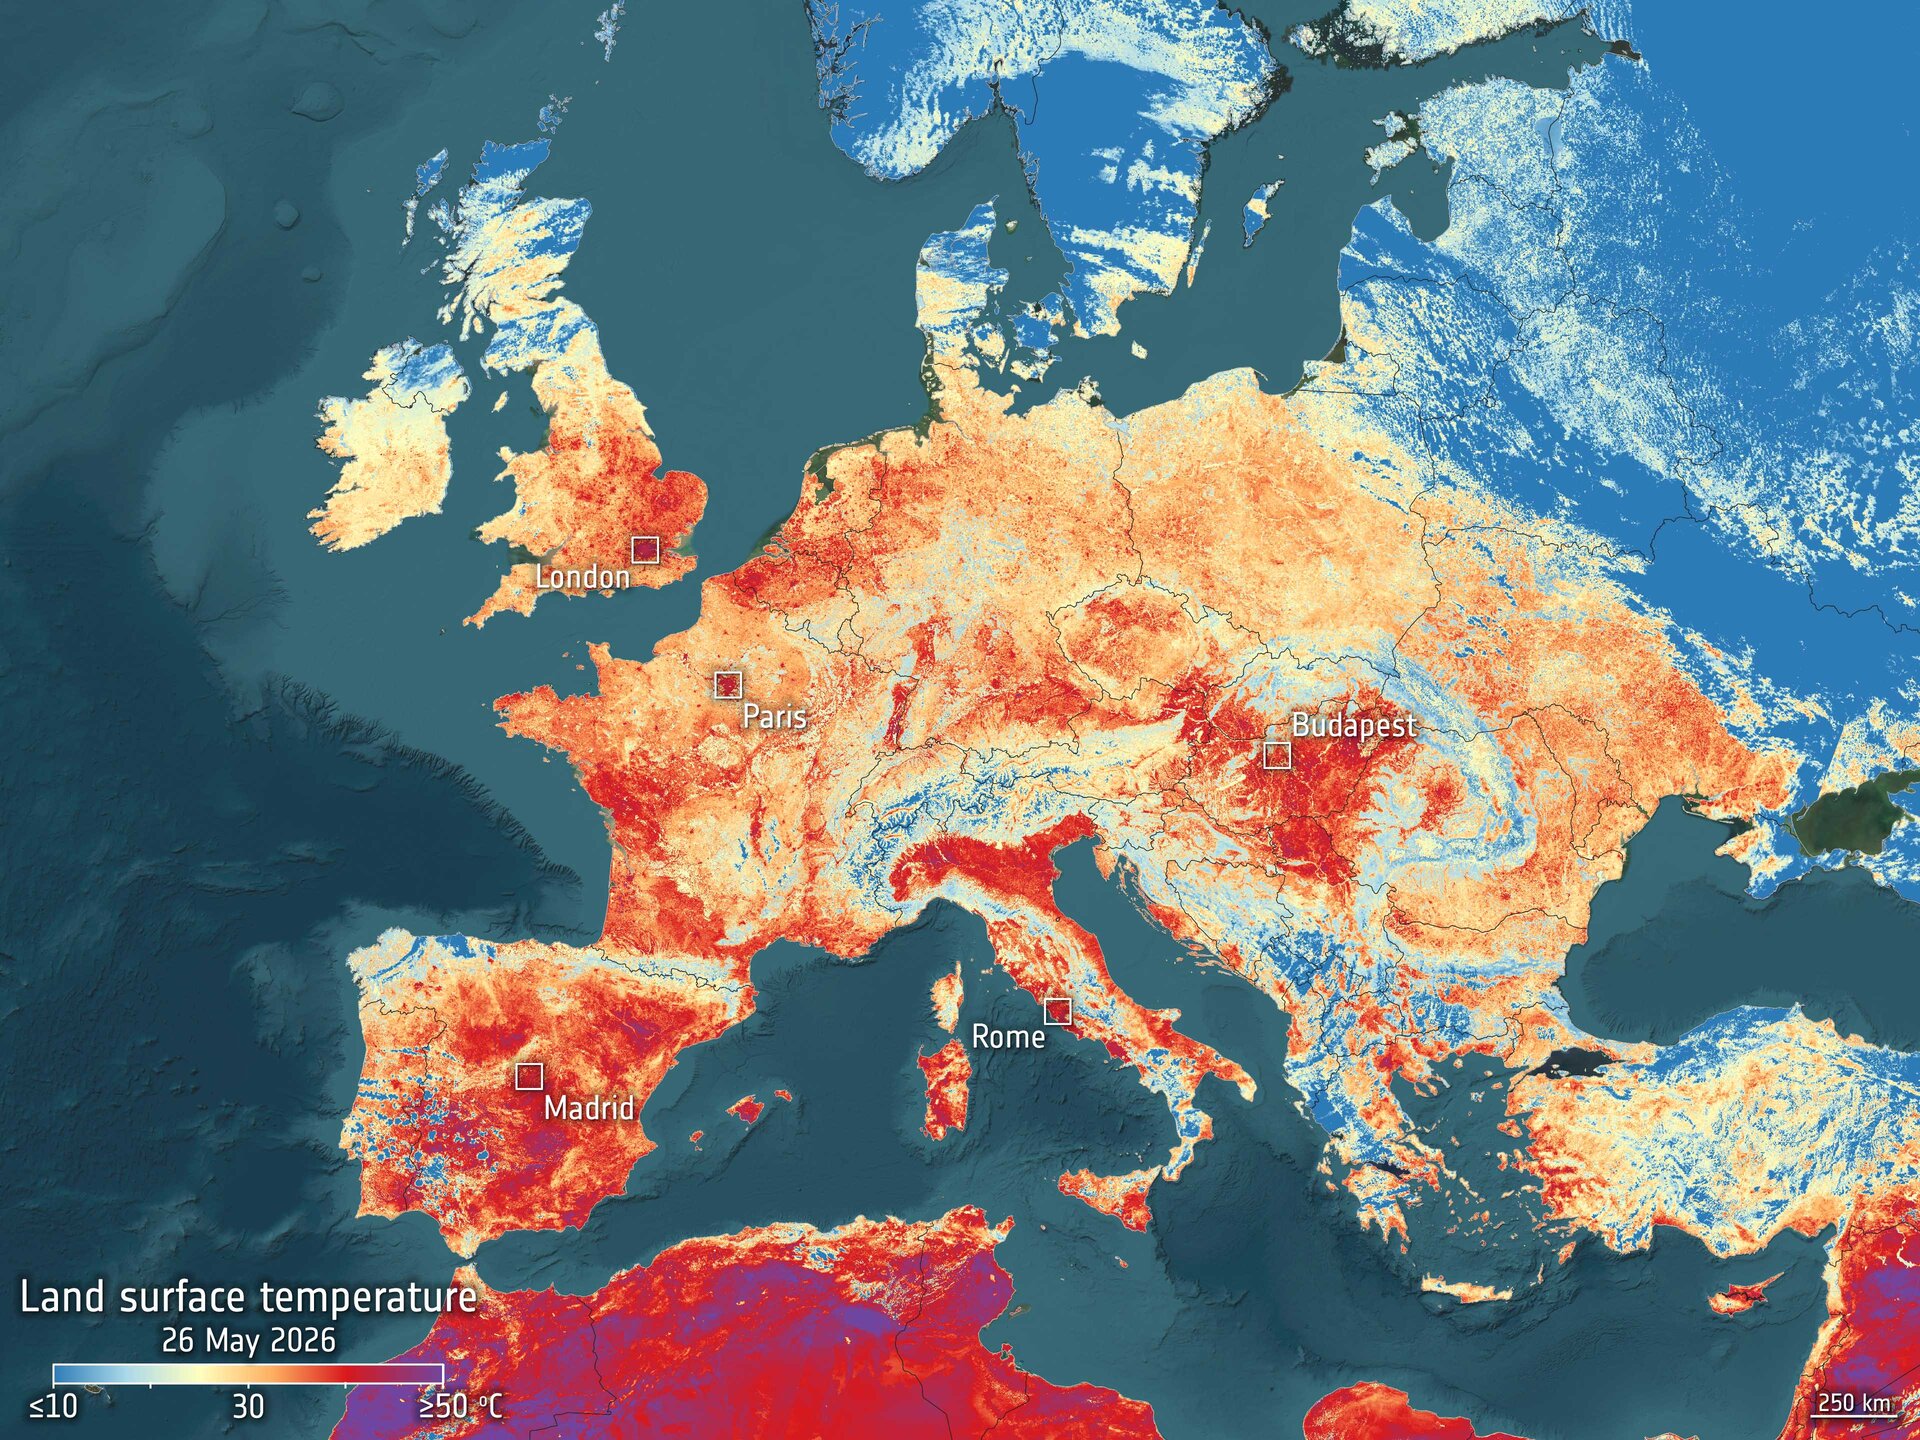
A fotografare l'esatta portata di questa eccezionale fiammata ci ha pensato il satellite Copernicus Sentinel-3 dell'Agenzia Spaziale Europea (ESA). L'immagine (catturata martedì 26 maggio) mostra un'Europa quasi interamente tinta di sfumature rosso fuoco e arancione scuro.
La mappa mostra la temperatura superficiale del suolo. Durante il giorno, e in presenza di ondate di caldo così violente, il suolo – in particolare le rocce, i terreni brulli e l'asfalto delle città – immagazzina e trattiene l'energia solare, raggiungendo temperature notevolmente più alte rispetto a quelle dell'aria sovrastante.
Dinamiche del genere sono quasi sempre provocate da una vera e propria "trappola atmosferica".
I dati sulla temperatura del suolo vengono utilizzati dagli scienziati per mappare in tempo reale lo stress della vegetazione, monitorare e prevedere gli incendi boschivi e controllare i livelli idrici di fiumi e laghi, messi a dura prova da un clima sempre più estremo.
Leggi l'articolo completo di seguito:
Riferimenti:
. . . . . . . . . .
Mi piace utilizzare questo spazio su steemlinks per condividere gli articoli che ritengo utili e interessanti e che provengono da fonti attendibili.
. . . . . . . . . .
ENGLISH VERSION
At this very moment, our continent is gripped by a very early and violent heat wave that is shattering May records across half of Europe, making late spring seem like a distant memory.
The European Space Agency (ESA)'s Copernicus Sentinel-3 satellite captured the exact extent of this exceptional blaze. The image (captured on Tuesday, May 26) shows Europe almost entirely tinged with fiery red and dark orange.
The map shows the surface temperature of the ground. During the day, and in the presence of such violent heat waves, the ground-particularly rocks, barren terrain, and the asphalt of cities-storages and retains solar energy, reaching temperatures significantly higher than those of the air above it.
Such dynamics are almost always caused by a veritable "atmospheric trap."
Soil temperature data is used by scientists to map vegetation stress in real time, monitor and predict forest fires, and control water levels in rivers and lakes, which are being strained by an increasingly extreme climate.
Read the full article below:
References:
. . . . . . . . . .
I like using this space on steemlinks to share articles I find useful and interesting, especially when they come from reliable sources.
. . . . . . . . . .
.jpg)

| NON PERDERTI IL NUOVO GIOCO SULLA BLOCKCHAIN DI STEEM | .gif) | |
| I'm part of ITALYGAME Team with: @girolamomarotta, @sardrt, @mad-runner, @frafiomatale, @famigliacurione |  | |
Upvoted! Thank you for supporting witness @jswit.
This post has been upvoted by @italygame witness curation trail
If you like our work and want to support us, please consider to approve our witness
Come and visit Italy Community