Dubai Real Estate Rental Transactions: 02 - 04 May 2026
Dubai Real Estate Registry Report – Rental Transactions
Transaction Period: 02 – 04 May 2026
Total Transactions: 2,173
Total Value: AED 1,884,436,925
A total of 2,173 rental contracts were registered over the three-day period, with a combined value of AED 1.88 billion. Renewed contracts accounted for the higher share of transaction volume, while new contracts carried the majority of total value.
Activity was concentrated in non-freehold properties, largely driven by large-scale unit leases. Residential usage dominated overall volume, with limited industrial and other activity recorded during the period.
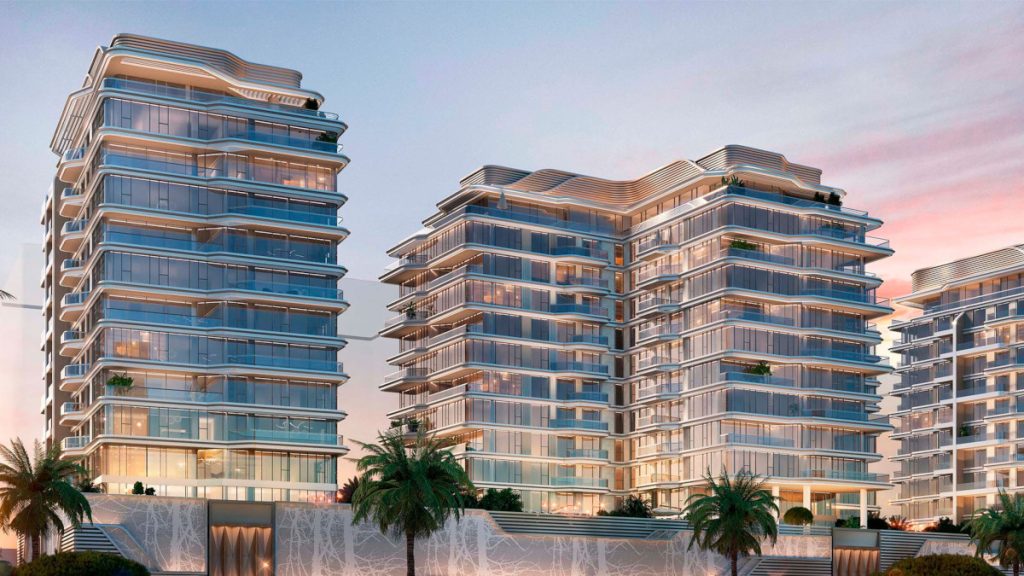
World-Class Waterfront Living at Edgewater Phase 3, Dubai Islands
Source: Building Arabia.
Transactions by Contract Type
| Category | Number of Transactions | Value (AED) | Value (USD) |
|---|---|---|---|
| New | 994 | 1,777,518,817 | 483,948,880 |
| Renewed | 1,179 | 106,918,108 | 29,112,536 |
| Grand Total | 2,173 | 1,884,436,925 | 513,061,416 |
Transactions by Property Ownership
| Category | Number of Transactions | Value (AED) | Value (USD) |
|---|---|---|---|
| Free Hold | 1037 | 121,585,703 | 33,106,110 |
| Non Free Hold | 1136 | 1,762,851,222 | 479,955,306 |
| Grand Total | 2,173 | 1,884,436,925 | 513,061,416 |
Transactions by Property Usage
| Category | Number of Transactions | Value (AED) | Value (USD) |
|---|---|---|---|
| Commercial | 358 | 50,162,614 | 13,658,974 |
| Industrial | 3 | 504,725 | 137,437 |
| Residential | 1811 | 1,833,704,586 | 499,260,349 |
| Other | 1 | 65,000 | 17,699 |
| Grand Total | 2,173 | 1,884,436,925 | 513,061,416 |
Transactions by Property Type
| Category | Number of Transactions | Value (AED) | Value (USD) |
|---|---|---|---|
| A) Unit | 1971 | 1,859,036,979 | 506,186,150 |
| Clinic | 1 | 200,000 | 54,459 |
| Flat | 1443 | 191,019,805 | 52,010,542 |
| Hotel | 14 | 767,500 | 208,999 |
| Labor Camps | 215 | 1,618,143,584 | 440,535,863 |
| Ladies Saloon | 1 | 120,000 | 32,675 |
| Mezzanine | 1 | 40,700 | 11,082 |
| Office | 145 | 10,325,482 | 2,811,423 |
| Restaurant | 1 | 423,764 | 115,382 |
| Shop | 105 | 17,414,818 | 4,741,986 |
| Showroom | 3 | 2,461,776 | 670,304 |
| Store | 1 | 100,000 | 27,229 |
| Studio | 18 | 519,050 | 141,325 |
| Warehouse | 20 | 16,488,900 | 4,490,058 |
| Workshop | 2 | 951,600 | 259,106 |
| Other | 1 | 60,000 | 16,338 |
| B) Villa | 136 | 24,256,447 | 6,604,885 |
| Complex Villas | 12 | 1,811,350 | 493,229 |
| Villa | 124 | 22,445,097 | 6,111,656 |
| C) Virtual Unit | 66 | 1,143,500 | 311,337 |
| Office | 65 | 1,123,500 | 305,922 |
| Shop | 1 | 20,000 | 5,446 |
| Grand Total | 2,173 | 1,884,436,925 | 513,061,416 |
Top 10 Localities by Value
| Category | Number of Transactions | Value (AED) | Value (USD) |
|---|---|---|---|
| Jabal Ali Industrial First | 160 | 1,595,652,270 | 434,409,434 |
| Eyal Nasser | 34 | 72,191,000 | 19,656,839 |
| Al Goze Third | 33 | 16,673,000 | 4,539,532 |
| Dubai Investment Park Second | 21 | 16,473,233 | 4,485,262 |
| Wadi Al Safa 3 | 5 | 14,892,000 | 4,054,967 |
| Al Karama | 62 | 13,116,078 | 3,571,142 |
| Business Bay | 116 | 7,274,036 | 1,980,453 |
| Al Barsha South Fourth | 96 | 6,555,971 | 1,784,963 |
| Dubai Investment Park First | 24 | 6,435,945 | 1,752,310 |
| Jabal Ali First | 77 | 5,102,293 | 1,389,326 |
A further 123 other localities recorded rental transactions during this period, with a combined value of AED 130,071,397 (USD 35,417,244). Examples from the next highest areas include Me’Aisem First, Madinat Hind 1, and Ras Al Khor Industrial Third.
Conclusion
Rental activity during the period was concentrated in unit-based contracts, with labor camps accounting for the majority of total value. Villas and virtual units represented a smaller share of overall activity.
At the locality level, Jabal Ali Industrial First dominated transaction value by a wide margin, while the remaining activity was distributed across a large number of smaller residential and mixed-use areas.
Disclaimer
This report is based on publicly available market transaction summaries and compiled data related to Dubai real estate activity for the stated period.
Figures are presented for informational purposes only and may vary from final official statistics published by the Dubai Land Department (DLD).
1 US Dollar = 3.6725 UAE Dirhams
This material does not constitute financial or investment advice. Real estate investments involve risk and readers should conduct independent research before making any investment decisions.