Dubai Real Estate Rental Transactions: 30 April 2026
Dubai Real Estate Rental Transactions
30 April 2026
A total of 3,896 rental transactions were registered with a combined value of AED 8,584,308,173. The activity covers new and renewed contracts across all property segments.
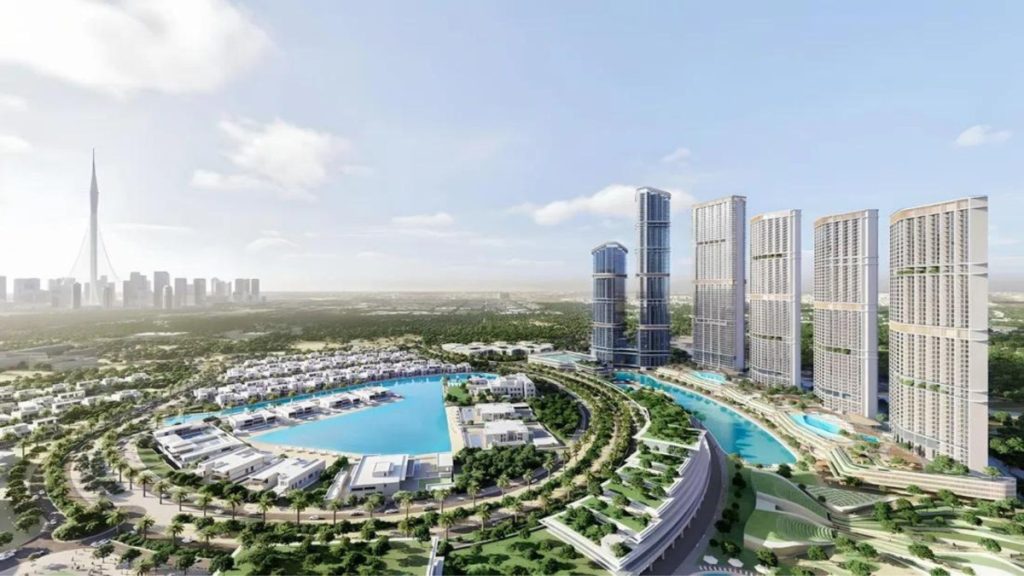
Sobha Skyscape Altius – Waterfront Residences, Sobha Hartland II, Bukadra - Dubai
Source: Building Arabia.
Transactions by Contract Type
| Category | Number of Transactions | Value (AED) | Value (USD) |
|---|---|---|---|
| New | 1,761 | 8,128,514,476 | 2,213,346,351.53 |
| Renewed | 2,135 | 455,793,697 | 124,109,924.30 |
| Grand Total | 3,896 | 8,584,308,173 | 2,337,456,275.83 |
Transactions by Property Ownership
| Category | Number of Transactions | Value (AED) | Value (USD) |
|---|---|---|---|
| Free Hold | 1,925 | 1,493,052,214 | 406,549,275.43 |
| Non Free Hold | 1,971 | 7,091,255,959 | 1,930,907,000.41 |
| Grand Total | 3,896 | 8,584,308,173 | 2,337,456,275.83 |
Transactions by Property Usage
| Category | Number of Transactions | Value (AED) | Value (USD) |
|---|---|---|---|
| Commercial | 859 | 718,628,237 | 195,678,212.93 |
| Industrial | 10 | 1,841,721 | 501,489.72 |
| Residential | 3,011 | 7,861,620,611 | 2,140,672,732.74 |
| Storage | 2 | 237,112 | 64,564.20 |
| Other | 14 | 1,980,493 | 539,276.51 |
| Grand Total | 3,896 | 8,584,308,173 | 2,337,456,275.83 |
Transactions by Property Type
| Category | Number of Transactions | Value (AED) | Value (USD) |
|---|---|---|---|
| A) Land | |||
| Other | 11 | 1,706,869 | 464,770.32 |
| Subtotal: Land | 11 | 1,706,869 | 464,770.32 |
| B) Unit | |||
| Clinic | 1 | 80,000 | 21,783.53 |
| Complex Warehouse | 1 | 185,000 | 50,374.40 |
| Flat | 2,297 | 1,894,966,602 | 515,988,182.98 |
| Hotel | 22 | 4,359,000 | 1,186,929.88 |
| Kiosk | 2 | 85,000 | 23,145.00 |
| Labor Camps | 283 | 93,712,917 | 25,517,472.29 |
| Mezzanine | 2 | 75,000 | 20,422.06 |
| Office | 300 | 190,889,193 | 51,977,996.73 |
| Open space | 1 | 54,940 | 14,959.84 |
| Restaurant | 2 | 1,080,000 | 294,077.60 |
| Shop | 262 | 464,066,998 | 126,362,695.17 |
| Showroom | 5 | 1,988,822 | 541,544.45 |
| Staff Accommodation | 2 | 96,000 | 26,140.23 |
| Store | 1 | 8,640 | 2,352.62 |
| Studio | 225 | 5,842,059,150 | 1,590,758,107.56 |
| Supermarket | 3 | 1,446,000 | 393,737.24 |
| Warehouse | 38 | 8,785,260 | 2,392,174.27 |
| Warehouse complex | 1 | 120,973 | 32,940.23 |
| Workshop | 1 | 60,000 | 16,337.64 |
| Subtotal: Unit | 3,449 | 8,504,119,495 | 2,315,621,373.72 |
| C) Villa | |||
| Complex Villas | 19 | 3,217,081 | 875,992.10 |
| Shop | 2 | 1,080,000 | 294,077.60 |
| Villa | 222 | 58,885,564 | 16,034,190.33 |
| Subtotal: Villa | 243 | 63,182,645 | 17,204,260.03 |
| D) Virtual Unit | |||
| Office | 191 | 9,285,945 | 2,528,507.83 |
| Shop | 1 | 5,993,219 | 1,631,918.04 |
| Warehouse | 1 | 20,000 | 5,445.88 |
| Subtotal: Virtual Unit | 193 | 15,299,164 | 4,165,871.75 |
| Grand Total | 3,896 | 8,584,308,173 | 2,337,456,275.83 |
Top 10 Localities by Value
| Category | Number of Transactions | Value (AED) | Value (USD) |
|---|---|---|---|
| Al Murqabat | 274 | 6,759,713,182 | 1,840,629,865.76 |
| Warsan Fourth | 127 | 1,041,746,177 | 283,661,314.36 |
| Al Goze Industrial Second | 165 | 138,465,552 | 37,703,486.04 |
| Wadi Al Safa 2 | 42 | 117,943,811 | 32,115,399.86 |
| Saih Shuaib 4 | 49 | 46,192,008 | 12,577,810.21 |
| Hadaeq Sheikh Mohammed Bin Rashid | 29 | 28,713,970 | 7,818,643.98 |
| Business Bay | 204 | 28,671,176 | 7,806,991.42 |
| Burj Khalifa | 89 | 27,196,469 | 7,405,437.44 |
| Dubai Investment Park Second | 110 | 27,116,599 | 7,383,689.31 |
| Al Wasl | 10 | 21,509,746 | 5,856,976.45 |
A further 129 localities recorded activity, with a combined value of AED 347,039,483.
Next highest areas include Al Goze Third, Al Thanyah Fifth, and Al Barsha South Fourth.
Closing Notes
New contracts accounted for the majority of total value, while renewed contracts represented a larger share of transaction count. Residential usage and unit-based properties dominated overall activity.
Transaction value was concentrated in a limited number of localities, with the remaining areas contributing a smaller share across a broad base of registrations.
Disclaimer
This report is based on publicly available market transaction summaries and compiled data related to Dubai real estate activity for the stated period.
Figures are presented for informational purposes only and may vary from final official statistics published by the Dubai Land Department (DLD).
1 US Dollar = 3.6725 UAE Dirhams
This material does not constitute financial or investment advice. Real estate investments involve risk and readers should conduct independent research before making any investment decisions.