Dubai Real Estate Sales Transactions: 22 April 2026
Dubai Real Estate Sales Report
22 April 2026
A total of 749 sales transactions were registered in Dubai on 22 April 2026, with a declared value of AED 3,053,734,451.
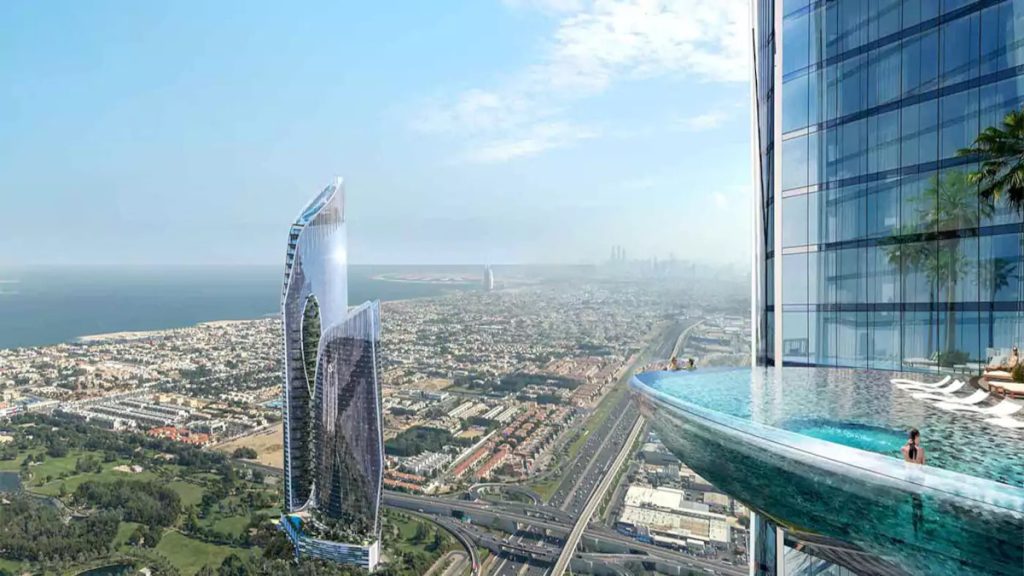
Safa Gate by DAMAC, Sheikh Zayed Road, Dubai
Source: Building Arabia.
By Sales Type
| Category | Number of Transactions | Value (AED) | Value (USD) |
|---|---|---|---|
| Gifts | 18 | 456,278,737 | 124,242,000 |
| Mortgage | 163 | 1,008,399,180 | 274,581,125 |
| Sales | 568 | 1,589,056,534 | 432,690,681 |
| Grand Total | 749 | 3,053,734,451 | 831,513,806 |
By Property Status
| Category | Number of Transactions | Value (AED) | Value (USD) |
|---|---|---|---|
| Off-Plan | 387 | 835,872,562 | 227,603,149 |
| Ready | 362 | 2,217,861,889 | 603,910,657 |
| Grand Total | 749 | 3,053,734,451 | 831,513,806 |
By Property Ownership
| Category | Number of Transactions | Value (AED) | Value (USD) |
|---|---|---|---|
| Free Hold | 715 | 2,137,935,845 | 582,147,269 |
| Non Free Hold | 34 | 915,798,606 | 249,366,537 |
| Grand Total | 749 | 3,053,734,451 | 831,513,806 |
By Property Usage
| Category | Number of Transactions | Value (AED) | Value (USD) |
|---|---|---|---|
| Commercial | 21 | 920,810,470 | 250,731,237 |
| Residential | 728 | 2,132,923,981 | 580,782,569 |
| Grand Total | 749 | 3,053,734,451 | 831,513,806 |
By Property Type
| Category | Number of Transactions | Value (AED) | Value (USD) |
|---|---|---|---|
| A) Building | |||
| Villa | 53 | 172,870,422 | 47,071,592 |
| Subtotal A) Building | 53 | 172,870,422 | 47,071,592 |
| B) Land | |||
| Commercial | 17 | 809,630,794 | 220,457,670 |
| General Use | 1 | 21,405,851 | 5,828,686 |
| Industrial | 3 | 89,579,676 | 24,392,015 |
| Labor Camp | 1 | 21,600,000 | 5,881,552 |
| Residential | 44 | 281,016,394 | 76,519,100 |
| Residential / Residential Villa | 6 | 6,400,000 | 1,742,682 |
| Villa | 3 | 63,499,000 | 17,290,402 |
| Other | 13 | 377,217,800 | 102,714,172 |
| Subtotal B) Land | 88 | 1,670,349,515 | 454,826,279 |
| C) Unit | |||
| Flat | 558 | 1,079,597,862 | 293,968,104 |
| Hotel Apartment | 11 | 39,560,812 | 10,772,175 |
| Hotel Rooms | 5 | 4,448,857 | 1,211,397 |
| Office | 28 | 57,910,955 | 15,768,810 |
| Shop | 6 | 28,996,028 | 7,895,449 |
| Subtotal C) Unit | 608 | 1,210,514,514 | 329,615,935 |
| Grand Total | 749 | 3,053,734,451 | 831,513,806 |
Top 10 Localities by Value
| Category | Number of Transactions | Value (AED) | Value (USD) |
|---|---|---|---|
| Palm Deira | 55 | 207,117,349 | 56,396,828 |
| Al Goze Fourth | 1 | 197,068,000 | 53,660,449 |
| Trade Center First | 1 | 186,000,000 | 50,646,698 |
| Oud Metha | 1 | 120,500,000 | 32,811,436 |
| CITY WALK | 20 | 95,008,039 | 25,869,990 |
| DUBAI INDUSTRIAL CITY | 7 | 92,498,963 | 25,186,920 |
| Al Saffa First | 1 | 87,508,699 | 23,828,100 |
| Mankhool | 1 | 81,840,000 | 22,284,547 |
| Mirdif | 2 | 76,930,000 | 20,947,583 |
| Dubai Investment Park Second | 4 | 72,469,940 | 19,733,136 |
Other active localities: 104
Combined value of other localities: AED 1,836,793,461
Examples from next highest areas: Hadaeq Sheikh Mohammed Bin Rashid, MAJAN, Al Barsha First.
Closing Notes
Ready properties recorded the larger share of declared value, while off-plan assets led transaction count. Residential usage accounted for most registrations, with commercial transactions concentrated in fewer but higher-value deals.
Land transactions represented the highest value among the main property type groups, while flats remained the most active subtype by volume.
Disclaimer
This report is based on publicly available market transaction summaries and compiled data related to Dubai real estate activity for the stated period.
Figures are presented for informational purposes only and may vary from final official statistics published by the Dubai Land Department (DLD).
1 US Dollar = 3.6725 UAE Dirhams
This material does not constitute financial or investment advice. Real estate investments involve risk and readers should conduct independent research before making any investment decisions.