Dubai Real Estate Rental Transactions: 17 June 2026
Dubai Real Estate Rental Transactions Report
17 June 2026
Dubai’s rental registry recorded 4,222 transactions on 17 June 2026 with a total declared value of AED 724,559,702.
Renewed contracts accounted for the larger share of volume, while new contracts carried the higher aggregate value. Residential leasing remained the dominant segment by transaction count.
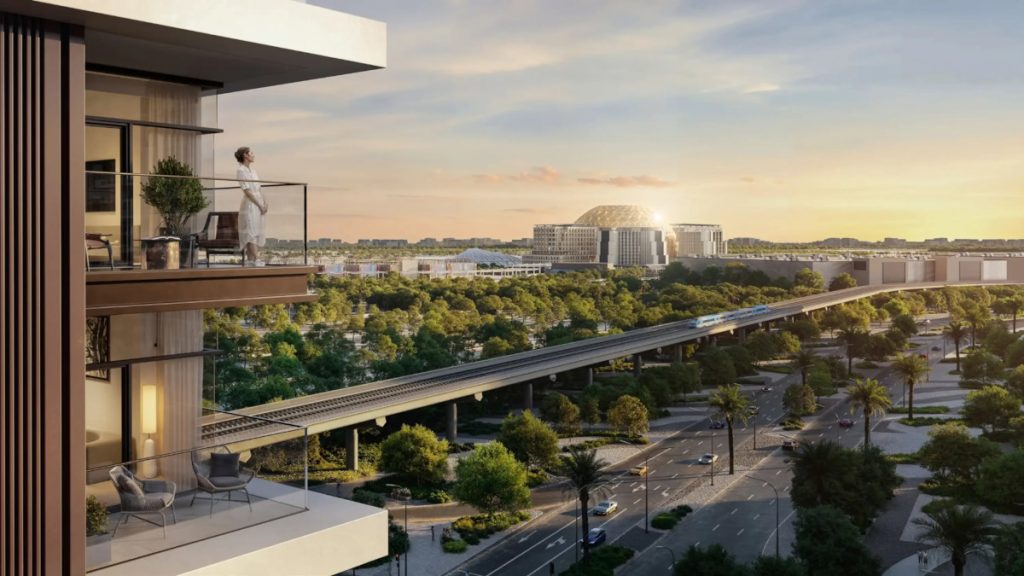
Expo Living Residences by Emaar, Dubai
Source: Building Arabia.
Rentals by Contract Type
| Category | Number of Transactions | Value (AED) | Value (USD) |
|---|---|---|---|
| New | 1,805 | 392,462,073 | 106,865,098 |
| Renewed | 2,417 | 332,097,629 | 90,428,218 |
| Grand Total | 4,222 | 724,559,702 | 197,293,316 |
Rentals by Property Ownership
| Category | Number of Transactions | Value (AED) | Value (USD) |
|---|---|---|---|
| Free Hold | 2,358 | 470,549,431 | 128,127,823 |
| Non Free Hold | 1,864 | 254,010,271 | 69,165,492 |
| Grand Total | 4,222 | 724,559,702 | 197,293,316 |
Rentals by Property Usage
| Category | Number of Transactions | Value (AED) | Value (USD) |
|---|---|---|---|
| Commercial | 1,050 | 297,175,279 | 80,919,068 |
| Industrial | 11 | 3,704,590 | 1,008,738 |
| Residential | 3,145 | 413,152,937 | 112,499,098 |
| Other | 16 | 10,526,895 | 2,866,411 |
| Grand Total | 4,222 | 724,559,702 | 197,293,316 |
Rentals by Property Type
| Category | Number of Transactions | Value (AED) | Value (USD) |
|---|---|---|---|
| A) Building | |||
| Building | 1 | 1,549,625 | 421,954 |
| Hotel | 1 | 8,000,000 | 2,178,353 |
| Subtotal A) Building | 2 | 9,549,625 | 2,600,306 |
| B) Land | |||
| Other | 14 | 2,331,042 | 634,729 |
| Subtotal B) Land | 14 | 2,331,042 | 634,729 |
| C) Unit | |||
| Clinic | 1 | 78,750 | 21,443 |
| Complex Warehouse | 1 | 85,000 | 23,145 |
| Flat | 2,524 | 235,745,382 | 64,192,071 |
| Health club | 3 | 326,000 | 88,768 |
| Hotel | 30 | 12,175,400 | 3,315,289 |
| Kiosk | 3 | 73,471 | 20,006 |
| Labor Camps | 300 | 108,790,377 | 29,622,975 |
| Mezzanine | 3 | 155,000 | 42,206 |
| Office | 389 | 72,000,337 | 19,605,265 |
| Open space | 1 | 233,333 | 63,535 |
| Parking | 1 | 188,000 | 51,191 |
| Restaurant | 4 | 579,250 | 157,726 |
| Shop | 336 | 88,533,639 | 24,107,186 |
| Showroom | 10 | 11,547,365 | 3,144,279 |
| Studio | 30 | 1,035,226 | 281,886 |
| Villa | 1 | 185,000 | 50,374 |
| Warehouse | 35 | 9,248,938 | 2,518,431 |
| Warehouse complex | 7 | 2,973,220 | 809,590 |
| Workshop | 6 | 900,782 | 245,278 |
| Subtotal C) Unit | 3,685 | 544,854,469 | 148,360,645 |
| D) Villa | |||
| Complex Villas | 18 | 3,283,995 | 894,212 |
| Shop | 2 | 140,000 | 38,121 |
| Villa | 281 | 66,003,458 | 17,972,351 |
| Other | 2 | 320,000 | 87,134 |
| Subtotal D) Villa | 303 | 69,747,454 | 18,991,821 |
| E) Virtual Unit | |||
| Office | 204 | 5,527,417 | 1,505,083 |
| Shop | 14 | 92,549,696 | 25,200,870 |
| Subtotal E) Virtual Unit | 218 | 98,077,113 | 26,705,953 |
| Grand Total | 4,222 | 724,559,702 | 197,293,316 |
Top 10 Localities by Transaction Value
| Category | Number of Transactions | Value (AED) | Value (USD) |
|---|---|---|---|
| Burj Khalifa | 174 | 167,546,012 | 45,621,787 |
| Jabal Ali Industrial First | 94 | 38,845,446 | 10,577,385 |
| Saih Shuaib 2 | 89 | 34,572,937 | 9,414,006 |
| Business Bay | 253 | 26,721,309 | 7,276,054 |
| Dubai Investment Park Second | 77 | 26,101,048 | 7,107,161 |
| Marsa Dubai | 93 | 24,082,118 | 6,557,418 |
| Al Goze Industrial First | 24 | 19,714,580 | 5,368,163 |
| Al Barsha First | 90 | 19,514,893 | 5,313,790 |
| Al Barsha South Fourth | 185 | 16,362,460 | 4,455,398 |
| Al Warsan First | 157 | 16,319,345 | 4,443,661 |
A further 157 active localities recorded rental transactions outside the top ten, with a combined value of AED 361,779,672 (USD 98,510,462). The next highest recorded areas included Naif, Al Thanyah Fifth, and Me'Aisem First.
Conclusion
The unit segment accounted for the largest share of rental activity, led by flats, labor camps, offices, and shops. Freehold properties represented the majority of registered rental value.
Leasing activity remained distributed across residential towers, industrial districts, and mixed-use commercial areas, with Burj Khalifa recording the highest single-day rental value among all localities.
Disclaimer
This report is based on publicly available market transaction summaries and compiled data related to Dubai real estate activity for the stated period.
Figures are presented for informational purposes only and may vary from final official statistics published by the Dubai Land Department (DLD).
1 US Dollar = 3.6725 UAE Dirhams
This material does not constitute financial or investment advice. Real estate investments involve risk and readers should conduct independent research before making any investment decisions.