Dubai Real Estate Sales Market Report 08 - 14 February 2026
Dubai Real Estate Sales Transactions Report
Period: 8 – 14 February 2026
Market Review
A total of 5,695 real estate sales transactions were recorded in Dubai during the second week of February 2026, with an aggregate value of AED 26,549,448,954. Transactions were registered across multiple sales types, property statuses, ownership structures, usage classifications, property types, and localities.
Sales transactions accounted for the majority of registrations and value, alongside mortgage and gift transactions. Activity was recorded across both Off-Plan and Ready properties, with participation observed in residential and commercial segments, as well as land, unit, and building property types.
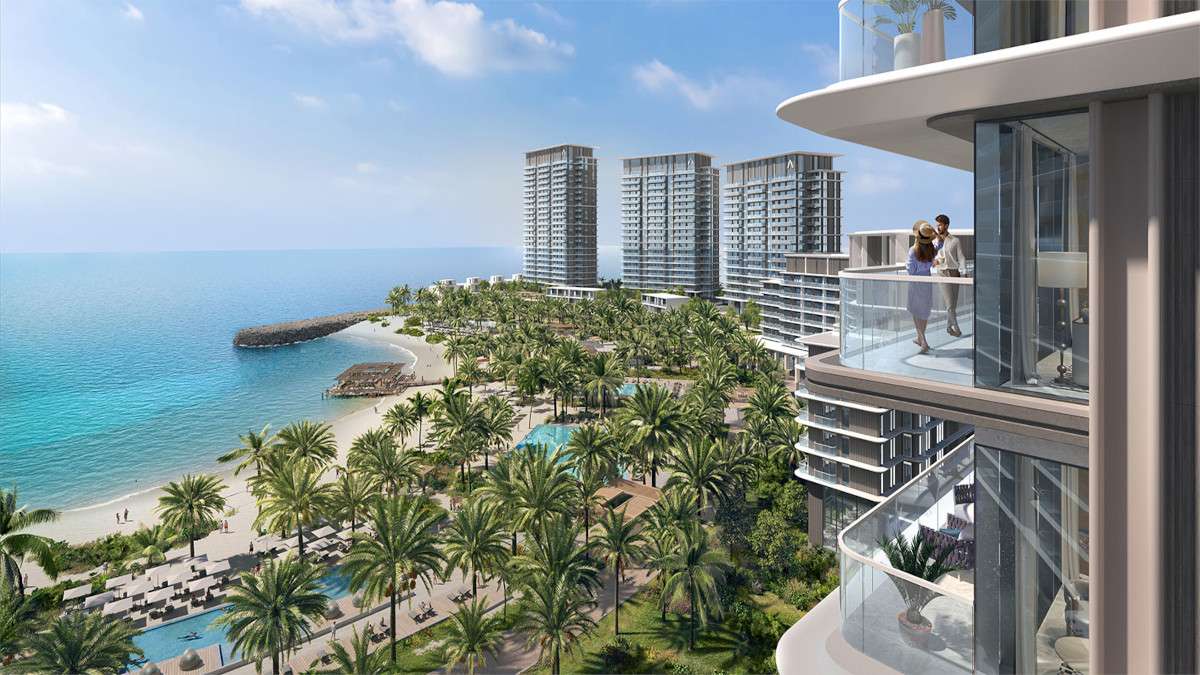
Luxury Beachfront Living at Address Residences Al Marjan Island
Source: Building Arabia.
Transactions by Sales Type
| Sales Type | Number of Transactions | Value (AED) | Value (USD) |
|---|---|---|---|
| Gifts | 157 | 3,474,231,229 | 938,042,432 |
| Mortgage | 1,056 | 4,427,480,515 | 1,195,419,739 |
| Sales | 4,482 | 18,647,737,210 | 5,034,889,047 |
| Grand Total | 5,695 | 26,549,448,954 | 7,168,351,218 |
Transactions by Property Status
| Property Status | Number of Transactions | Value (AED) | Value (USD) |
|---|---|---|---|
| Off-Plan | 2,821 | 6,880,315,695 | 1,857,685,238 |
| Ready | 2,874 | 19,669,133,259 | 5,310,665,980 |
| Grand Total | 5,695 | 26,549,448,954 | 7,168,351,218 |
Transactions by Property Ownership Type
| Ownership Type | Number of Transactions | Value (AED) | Value (USD) |
|---|---|---|---|
| Free Hold | 5,440 | 25,164,164,273 | 6,794,324,354 |
| Non Free Hold | 255 | 1,385,284,682 | 374,026,864 |
| Grand Total | 5,695 | 26,549,448,954 | 7,168,351,218 |
Transactions by Property Usage
| Property Usage | Number of Transactions | Value (AED) | Value (USD) |
|---|---|---|---|
| Commercial | 272 | 4,929,952,767 | 1,331,087,247 |
| Residential | 5,423 | 21,619,496,187 | 5,837,263,971 |
| Grand Total | 5,695 | 26,549,448,954 | 7,168,351,218 |
Transactions by Property Type
| Property Type | Number of Transactions | Value (AED) | Value (USD) |
|---|---|---|---|
| A) Building | |||
| Villa | 574 | 2,041,042,810 | 551,081,559 |
| B) Land | |||
| Airport | 2 | 9,391,440 | 2,535,689 |
| Commercial | 264 | 4,684,417,085 | 1,264,792,613 |
| General Use | 36 | 952,408,370 | 257,150,260 |
| Government Housing | 10 | 49,850,000 | 13,459,500 |
| Industrial | 7 | 242,535,682 | 65,484,634 |
| Labor Camp | 1 | 3,000,000 | 810,000 |
| Land | 16 | 119,490,357 | 32,262,396 |
| Residential | 230 | 1,726,130,438 | 466,055,218 |
| Residential / Villas | 1 | 28,500,000 | 7,695,000 |
| Residential Flats | 13 | 203,995,000 | 55,078,650 |
| Villa | 9 | 52,775,591 | 14,249,410 |
| Other | 70 | 4,335,988,673 | 1,170,716,942 |
| C) Unit | |||
| Flat | 4,157 | 7,780,020,034 | 2,100,605,409 |
| Hotel Apartment | 63 | 177,008,038 | 47,792,170 |
| Hotel Rooms | 27 | 25,684,163 | 6,934,724 |
| Office | 159 | 565,145,024 | 152,589,156 |
| Shop | 53 | 278,627,745 | 75,229,491 |
| Sized Partition | 3 | 3,273,438,504 | 883,828,396 |
| Grand Total | 5,695 | 26,549,448,954 | 7,168,351,218 |
Transactions by Locality
Top 10 Localities by Value
| Locality | Number of Transactions | Value (AED) | Value (USD) |
|---|---|---|---|
| PALM JUMEIRAH | 47 | 3,898,396,204 | 1,052,566,975 |
| Al Yelayiss 1 | 294 | 3,249,673,437 | 877,411,828 |
| Warsan Fourth | 142 | 1,877,158,530 | 506,832,803 |
| Saih Shuaib 1 | 1 | 1,293,294,500 | 349,189,515 |
| Palm Deira | 139 | 1,236,178,754 | 333,768,264 |
| BUSINESS BAY | 443 | 1,211,721,804 | 327,164,887 |
| JUMEIRAH VILLAGE CIRCLE | 409 | 561,249,410 | 151,537,341 |
| Al Wasl | 117 | 519,991,651 | 140,397,746 |
| Me'Aisem Second | 31 | 506,703,039 | 136,809,821 |
| Madinat Al Mataar | 236 | 464,698,649 | 125,468,635 |
Other Active Localities:
Sales transactions were recorded across 130 other localities, with a combined value of AED 11,730,382,976. Activity was registered in areas such as Jumeirah First, JUMEIRAH GOLF, DUBAI HILLS, Marsa Dubai, and BUSINESS PARK.
Conclusion
Dubai’s real estate sales activity during 8–14 February 2026 comprised 5,695 recorded transactions across all major sales types, property statuses, ownership structures, and usage categories reflected in the dataset. Registered transactions covered land, unit, and building property types, with participation observed across a broad range of residential and commercial localities.
The distribution of transaction values and counts across multiple property classifications and geographic areas reflects a diversified pattern of recorded market activity during the reporting period.
Disclaimer:
This report is based on publicly available data and Dubai Land Department (DLD) transaction summaries as of the date mentioned in the title of this post.
Final and detailed figures from the DLD may vary upon official release.
1 US Dollar = 3.6725 UAE Dirhams
This report is merely informative, and all investments come with risk. You are responsible for your decisions.