STEEM Dollar (SBD) Analysis of a Primary & an Alternate Price Pathway

SUMMARY
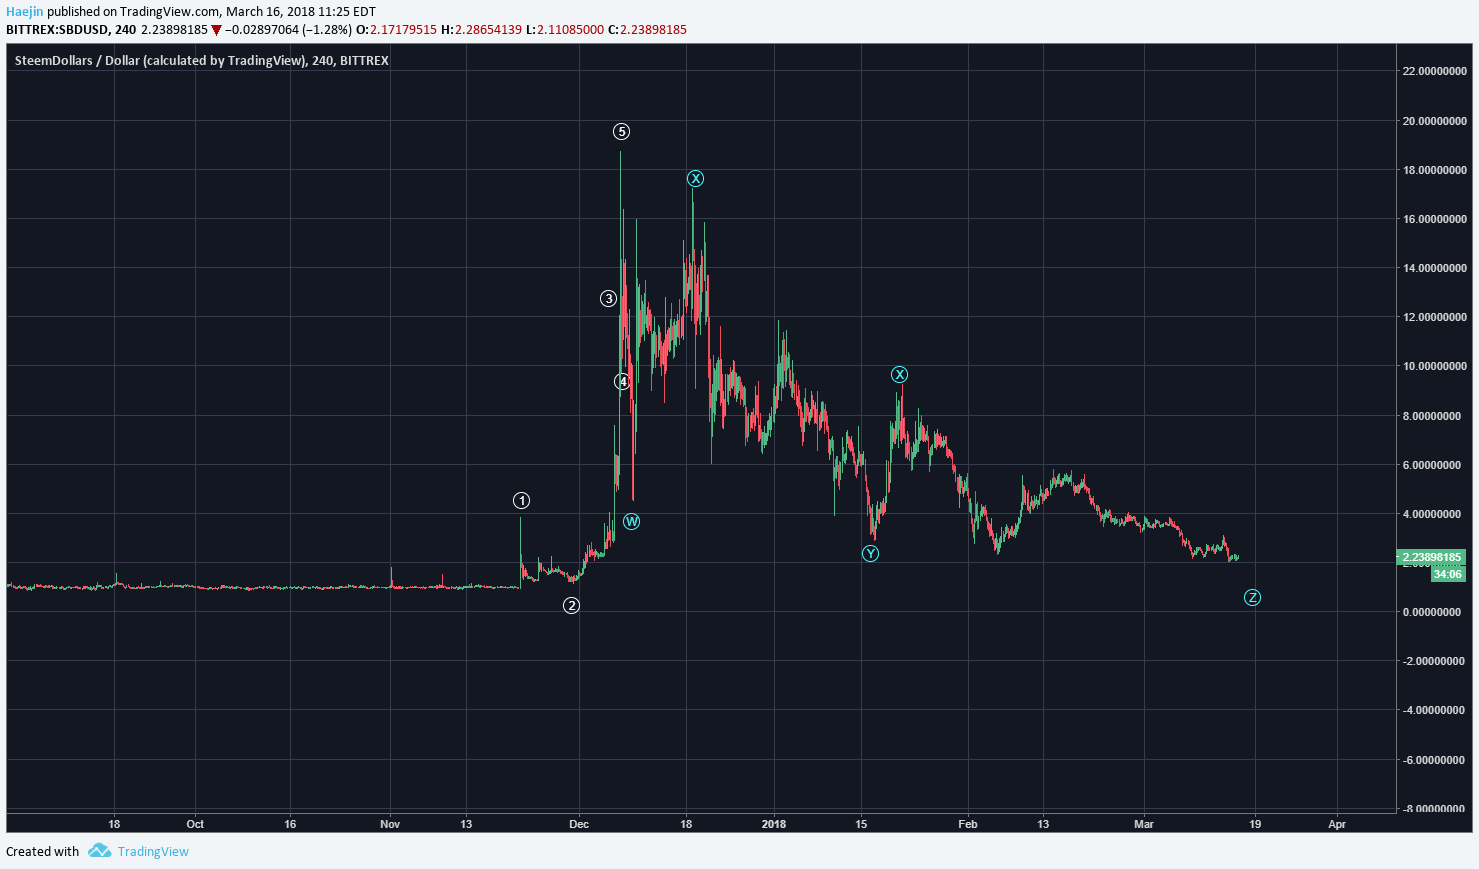
My long term analysis of STEEM Dollar (SBD) has not changed a bit! I remain bullish on STEEM and SBD. The shorter term assessment is shown in the below charts. The blue WXYXZ lables show that the correction is near completion. Price can still meander sideways but that would only extend the Z wave and that needs to be kept into awareness.
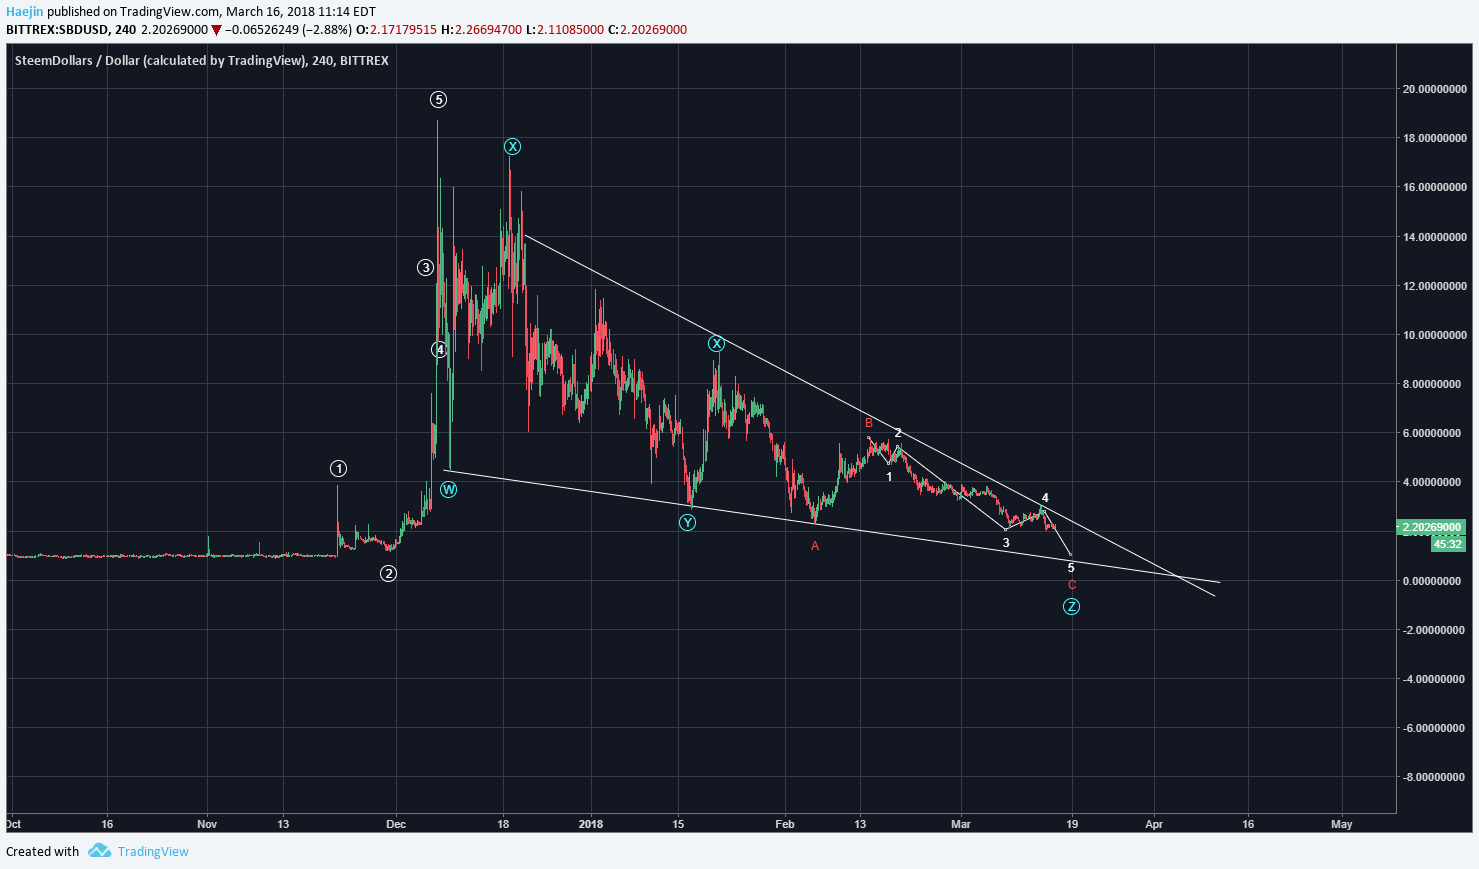
Closeup Elliott Wave counts show that the blue Z completion would likely require a slightly lower low. The subwaves red abc and red c's subwaves show that wave 5 still remains incomplete. Also, note that the projected bottom price is pretty close to the prior wave 2 zone.
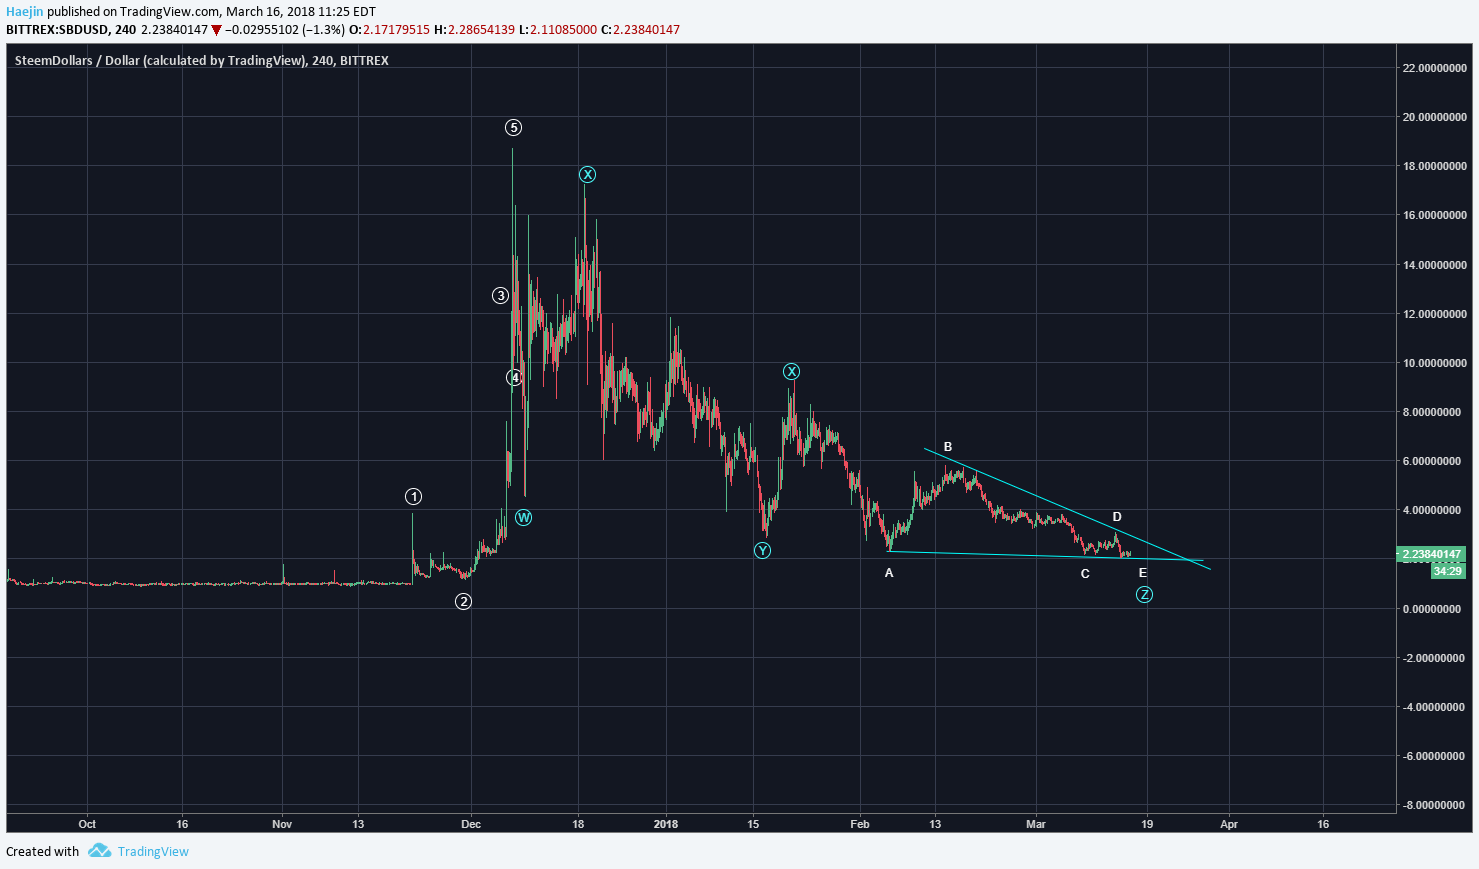
The WXYXZ also can be more complex when the Z morphs into a triangle. The below shows this as an alternate where the last abcde waves can complete the blue Z wave.
Legal Disclaimer: I am not a financial advisor nor is any content in this article presented as financial advice. The information provided in this blog post and any other posts that I make and any accompanying material is for informational purposes only. It should not be considered financial or investment advice of any kind. One should consult with a financial or investment professional to determine what may be best for your individual needs. Plain English: This is only my opinion, make of it what you wish. What does this mean? It means it's not advice nor recommendation to either buy or sell anything! It's only meant for use as informative or entertainment purposes.
Please consider reviewing these Tutorials on:
Elliott Wave Counting Tutorial #1
Elliott Wave Counting Tutorial #2
Elliott Wave Counting Tutorial #3
Laddering and Buy/Sell Setups.
Laddering Example with EOS
Tutorial on the use of Fibonacci & Elliott Waves
@haejin's Trading Nuggets
Essay: Is Technical Analysis a Quantum Event?
Follow me on Twitter for Real Time Alerts!!
Follow me on StockTwits for UpDates!!
--
--


So 2 months ago, you said it was "at the cusp of a massive breakout up!", but it has only gone down since then. Three months ago, you said it was "about to turn up". A week before that, you said "a new setup of impulse is starting so blue 1 and 2 are done that leaves blue 3,4,5 towards $31.45!!". I was wondering if you could explain this. I'm honestly not trying to call you out or anything. I just think this really needs explaining. I know you claim (or have claimed in the past) a high percentage of accuracy. Do you include examples such as the three given in that analysis? If so, do you count them as hits or misses?
How about after the corrextion is over. New rally?
thanks
Haejin is full of shit and his charts are too.
Which Chart Pattern Do You Believe in the Most?! https://steemit.com/bitcoin/@investingtips/every-chart-pattern-i-can-see-on-bitcoin-usd-right-now
You just hit the point
> Closeup Elliott Wave counts show that the blue Z completion would likely require a slightly lower low.
> The below shows this as an alternate where the last abcde waves can complete the blue Z wave.
Coins mentioned in post:
thank you sir @haejin for the information. I like the developments in this platform. it's fun if I can be like you. it mtay take 1 or 2 years to become like you. I always follow you and resteem your post. thank you once again i say.
gracias por compartir la información
Price broke $2.00, need to see higher lows on the daily candles in order to have any chance of moving higher, ideally need to break $3.50, until then, price will continue to trend lower.