Bitcoin Chart Analysis , I'm Sure you Don't Wanna Miss this one *Important
Hi Steemit Fellows !
As always i posted everyday Bitcoin Chart Anaylsis fro you Guys so you don't get left behind with the Market this one is important to understand and Know.....
If you been following me i shared yesterday Bitcoin Broke 50 M.a (moving average Daily which is not a Good Sign At All )
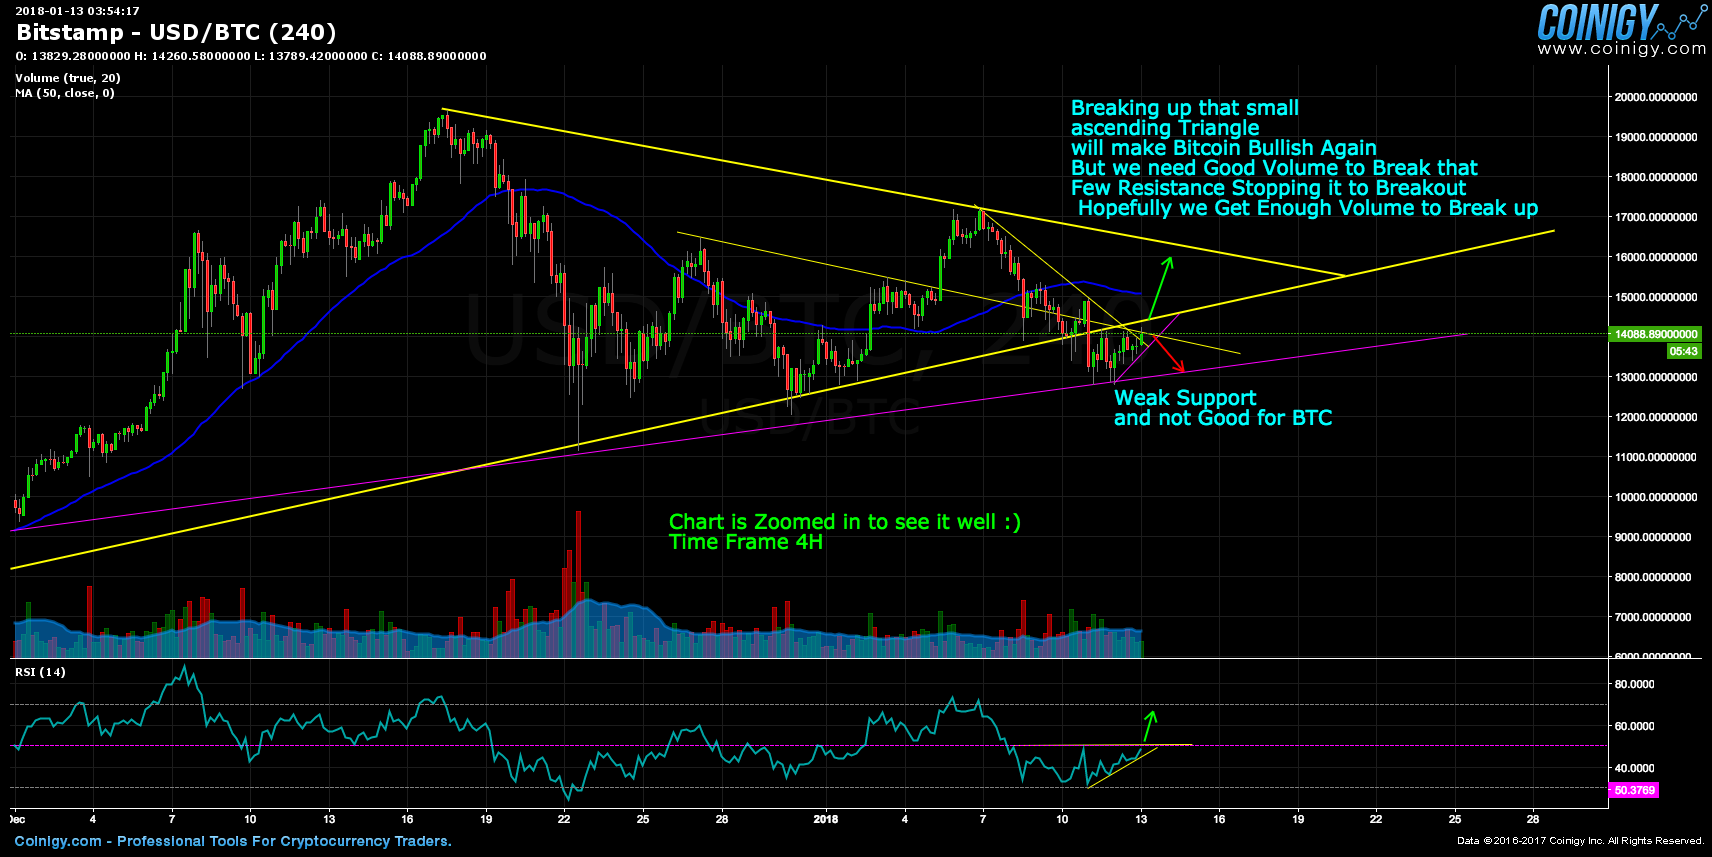
Look at This chart and Read if you can't Zoom in
USe this link : https://www.coinigy.com/s/i/5a5982e9568d9/
We Really Need to Break that by Next 4 to 8h $14500 and close up 4h Candle ......RSI needs to break 50 level too up as you see in the bottom
Edited : i forgot to mention MACD 4h is Bullish too and we have few Bitcoin news and forks , that may help ;)
If We Break that down we can see $11k but the chances are lower and there are many trend line getting support between 10 to $13k to give bounce and support
Hope this was helpful and you get the point
Now Smsh that Upvote Button for Daily Crypto Market Updates :)
I'm a Crypto Trader and here to Help for FREE ,
Feel Free to Resteem / share to your followers :)
Upvote if you like it and Make Sure to Follow me if you wanna get Daily Crypto market Updates :)
Good analysis bro!!!!
The chart and your presentation gives us clear explanation of what bitcoin going through today market.
By 15 January 2018 the market will be bullish again... ☺️
Yeah few forks upcoming btw Thank you so much for your support :)
Its good thing to keep an eye on btc ,because we know any movement in btc can suffer alts a lot.
Agree that's why i'm always aware of bitcoin and take action in alts when needed :)
people are just not selling at this low
Yes looks strong
it is very important to keep an eye on bitcoin every single minute in pump&dump situation ;)
good analysis
Thanks for the support pretty sure it will 😊
Interesting facts. Hope for good
Hope is the onky thing right now 😉
good information as always :) but i think btc will pump again :) what do u think
Hopefully it will Thanks for the support 😊
Very well analysis bro.you are great
Thanks 😊
You can also check on 1day chart.
It show bull flag now.
If support strong, soon will pump.
So far 1day didnt had too much info so i went with 4h and yes it looks good
Thanks Arslan for sharing this post about Bitcoin chart analysis
That’s a pretty good analysis. Hope good will come and our pockets would be filled ;)