Steem API Health — Daily Report 2026-08-15
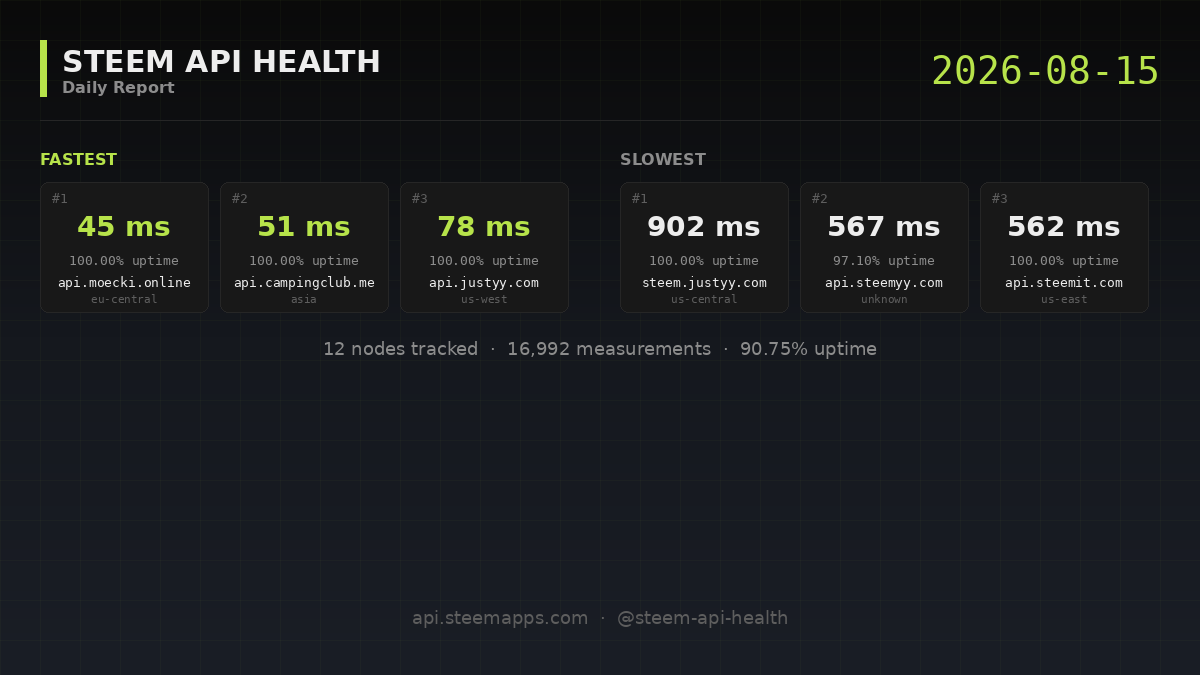
On 2026-08-15 (UTC) the monitor tracked 12 Steem API nodes with a global uptime of 90.75% across 16,992 measurements. Median latency across all nodes: 132 ms. Today's full picture and notable patterns below.
All measurements are taken from a single European location (Germany). Latency to nodes hosted outside Europe will naturally be higher than for users connecting from those regions. Want to contribute measurements from your region? See the participation block below.
Observations
- Longest outage today:
steemd.blazeapps.org, 1416 consecutive failed minutes. - Fastest node:
api.moecki.onlineat 45 ms average. That is 242 ms below the fleet average of 287 ms across 11 nodes. - Slowest node:
steem.justyy.comat 902 ms average. That is 615 ms above the fleet average of 287 ms. - Consistent leader:
api.campingclub.mehas been in the top 3 by latency every day this week. - Consistent leader:
api.justyy.comhas been in the top 3 by latency every day this week. - Consistent leader:
api.moecki.onlinehas been in the top 3 by latency every day this week. - Consistent laggard:
api.steemit.comhas been in the bottom 3 by latency every day this week. - Consistent laggard:
api.steemyy.comhas been in the bottom 3 by latency every day this week. - Consistent laggard:
steem.justyy.comhas been in the bottom 3 by latency every day this week.
Nodes
| Node | Region | Uptime | Avg | p50 | p95 | p99 | Errors | Error classes |
|---|---|---|---|---|---|---|---|---|
api.moecki.online | eu-central | 100.00 % | 45 ms | 41 ms | 63 ms | 185 ms | 0 | — |
api.campingclub.me | asia | 100.00 % | 51 ms | 50 ms | 64 ms | 83 ms | 0 | — |
api.justyy.com | us-west | 100.00 % | 78 ms | 71 ms | 97 ms | 253 ms | 0 | — |
steemd.steemworld.org | eu-central | 100.00 % | 101 ms | 101 ms | 105 ms | 122 ms | 0 | — |
api3.justyy.com | asia | 100.00 % | 132 ms | 111 ms | 136 ms | 840 ms | 0 | — |
api.steem.fans | asia | 100.00 % | 183 ms | 178 ms | 194 ms | 510 ms | 0 | — |
api2.steemyy.com | global | 100.00 % | 406 ms | 238 ms | 903 ms | 935 ms | 0 | — |
api.steemit.com | us-east | 100.00 % | 562 ms | 552 ms | 585 ms | 851 ms | 0 | — |
steem.justyy.com | us-central | 100.00 % | 902 ms | 829 ms | 1101 ms | 3469 ms | 0 | — |
api.steemyy.com | unknown | 97.10 % | 567 ms | 459 ms | 772 ms | 3395 ms | 41 | http_4xx ×38, rpc_error ×3 |
steem.senior.workers.dev | global | 91.88 % | 129 ms | 127 ms | 170 ms | 234 ms | 115 | http_4xx ×114, rpc_error ×1 |
steemd.blazeapps.org | eu-central | 0.00 % | — | — | — | — | 1416 | http_5xx ×1416 |
Latency distribution
Across 15,420 successful measurements today: 67.1 % under 200 ms, 74.3 % under 500 ms, 98.8 % under 1 000 ms. (1.2 % were slower than 1 second.)
Time-of-day pattern
Best hour today: 01:00–02:00 UTC (avg latency 269 ms, 648 measurements). Worst hour: 14:00–15:00 UTC (avg latency 310 ms, 635 measurements).
Error pattern
Most common error today: http_5xx (90.1 %), followed by http_4xx (9.7 %), followed by rpc_error (0.3 %) (of 1,572 total errors).
Biggest outage of the day
steemd.blazeapps.org had a stretch of 1416 consecutive failed minutes today. Full per-tick view: node detail page.
Week over week
Week-over-week: current week 88.81 %, previous week 88.03 % (Δ +0.77 pp).
| Node | Δ uptime |
|---|---|
steem.senior.workers.dev | -22.07 pp |
steemd.steemworld.org | -0.01 pp |
api.steemit.com | ±0.00 pp |
steemd.blazeapps.org | ±0.00 pp |
api.justyy.com | ±0.00 pp |
api.steem.fans | +0.02 pp |
api.campingclub.me | +0.02 pp |
api.moecki.online | +0.10 pp |
api2.steemyy.com | +0.14 pp |
api.steemyy.com | +4.43 pp |
steem.justyy.com | +9.24 pp |
api3.justyy.com | +17.37 pp |
Best vs worst performance gap
The fastest node was 20.04× faster than the slowest today (45 ms vs 902 ms). Last week the same factor was 31.86× — the gap is narrowing.
30-day reliability ranking
Most reliable
steemd.steemworld.org— 99.99 %
api.campingclub.me— 99.99 %
api.steemit.com— 99.96 %
Least reliable
steemd.blazeapps.org— 0.00 %
api.steem.fans— 47.12 %
steem.senior.workers.dev— 92.72 %
Longest unbroken uptime streak: api.campingclub.me — 14 days without a single failed tick.
Visual detail
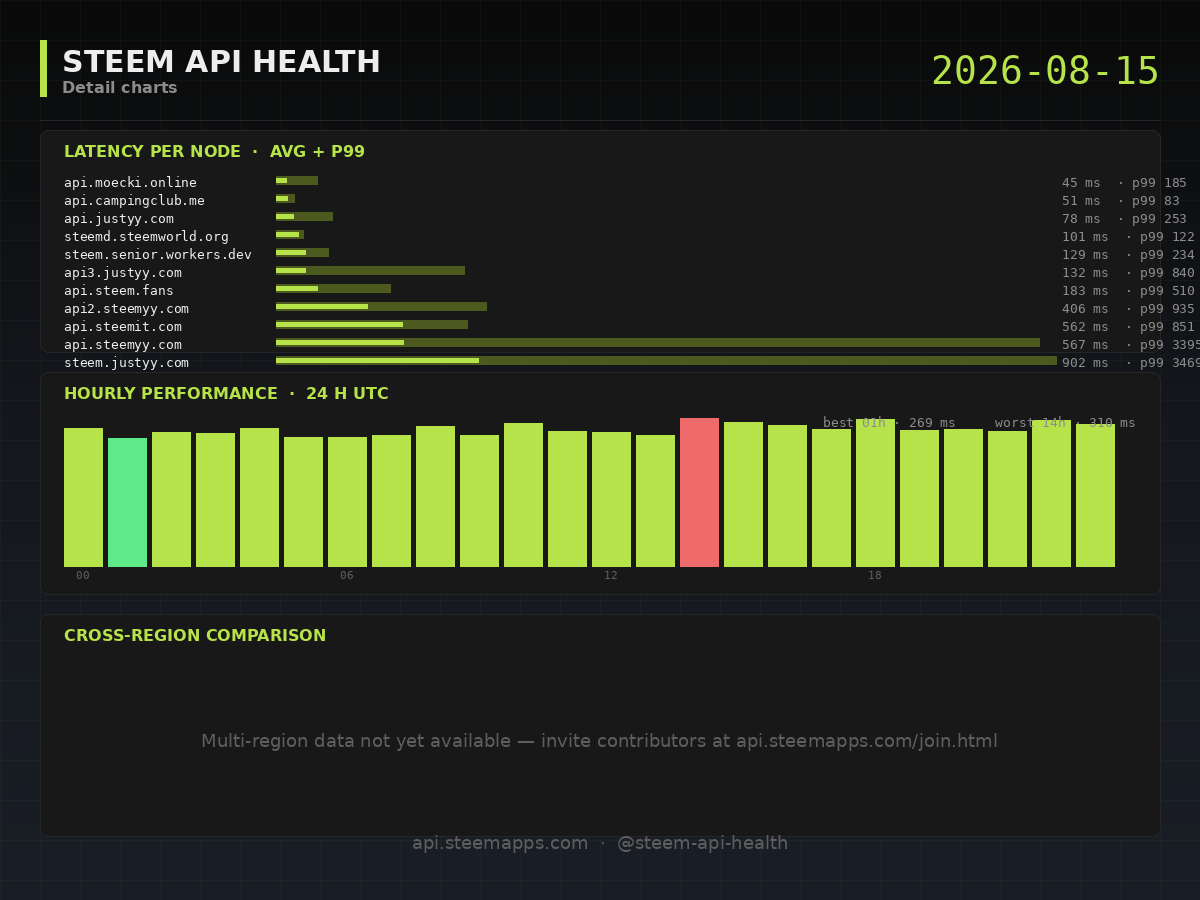
Top: latency distribution per node. Middle: hourly performance. Bottom: cross-region comparison (when multi-source data is available).
Methodology: one condenser_api.get_dynamic_global_properties request per node every 60 seconds, 8-second timeout. Full rules and thresholds in MEASUREMENT-METHODOLOGY.
Want to make these reports more accurate?
Anyone can contribute measurements from their own server. The participant script runs in Docker (3 commands to install) and helps build a global view of node performance.
- Participant script and instructions: https://github.com/greece-lover/steemapps-monitor/tree/main/participant
- Full participation guide: https://github.com/greece-lover/steemapps-monitor/blob/main/docs/PARTICIPATE.md
- Request an API key: visit https://api.steemapps.com/join.html — fully automated, takes about 2 minutes.
Contributors get attribution on the Sources page.
Feedback wanted
Have ideas for additional metrics, views, or analyses you'd like to see? Leave a comment below — the report format is still evolving and your input shapes future versions.
Resources
- Live dashboard: https://api.steemapps.com
- API documentation: https://github.com/greece-lover/steemapps-monitor/blob/main/docs/API.md
- Source code: https://github.com/greece-lover/steemapps-monitor
- Methodology: https://github.com/greece-lover/steemapps-monitor/blob/main/docs/MEASUREMENT-METHODOLOGY.md
- Raw data of this report:
custom_jsonoperationsteemapps_api_stats_daily, transactiond1bc4380ba6b5073f7f9213e641944a22a0e91c2in block4116 - Reporter account: @steem-api-health
- Operated by: @greece-lover (witness vote: https://steemitwallet.com/~witnesses)
Measurement window: 2026-08-15T00:00:00Z — 2026-08-16T00:00:00Z. Source location: contabo-de-1.